Understanding Screen Coordinates in Gazepoint Data
When you first look at Gazepoint’s eye gaze data you’ll notice that gaze coordinates aren’t reported in pixels. Instead, the FPOGX and FPOGY fields (and similar coordinate outputs) return decimal values between 0.0 and 1.0. This article explains what that range means, why Gazepoint uses it, and how to reliably convert to pixel coordinates for your specific display.
What Does 0 to 1 Mean?
Gazepoint reports gaze position as a normalized coordinate of the screen. Rather than tying output to a fixed resolution, the device reports where on the screen the participant is looking as a fraction of the total screen dimensions.
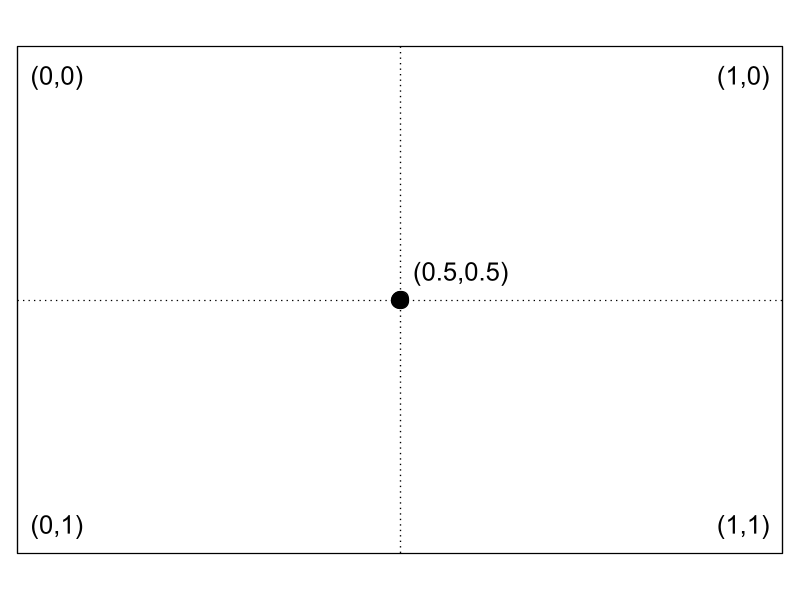
A value of 0.5, 0.5 means the participant’s gaze was at the center of the display, regardless of whether the monitor is 1920×1080, 2560×1440, or 3840×2160.
This resolution-independent approach makes Gazepoint data portable. The same raw data file can be re-analyzed at a different display resolution without re-recording, and multi-site studies with different monitor setups remain comparable.
Why Not Just Report Pixels?
Pixel coordinates seem more intuitive at first, but they come with real practical downsides. Resolution dependence means a pixel value of (960, 540) only means “screen center” on a 1920×1080 display. For cross-site comparability, labs with different monitors would produce incompatible raw data. Normalized coordinates also align naturally with percentage-based stimulus layouts, and analysis tools can import data without needing to know the recording resolution.
Normalized coordinates solve all of these problems. The conversion to pixels happens once, in your analysis, where you can apply the correct resolution for each context.
Converting to Pixels
The conversion is a simple multiplication. You need two things: the screen width in pixels and the screen height in pixels.
pixelx = FPOGX × screen width
pixely = FPOGY × screen height
Where FPOGX and FPOGY are the normalized gaze values (0.0 – 1.0).
Values Outside 0–1: Tracking Off-Screen
Under normal operation, values fall cleanly within [0.0, 1.0]. However, you may occasionally see values slightly outside this range — for example, -0.02 or 1.04. This happens when the tracker’s interpolation places the gaze point just beyond the physical screen boundary. For heatmap or AOI analysis, out-of-range values are typically discarded rather than clamped, as they indicate gaze was not directed at the stimulus.
Summary
Gazepoint’s 0-to-1 coordinate system is a deliberate design choice that makes your data resolution-independent and highly portable. (0, 0) is the top-left corner. (1, 1) is the bottom-right corner. (0.5, 0.5) is screen center. You can multiply by your screen resolution to get pixels. By understanding how Gazepoint’s normalized coordinate system works and applying the simple pixel conversion formula, researchers and developers can confidently work with gaze data across any display setup. To learn more about Gazepoint’s eye tracking and biometrics solutions, contact us to learn more!