Below you will find instructions and walkthroughs to help you get your software and eye tracker set up for your neuromarketing study and more. If you still need more instructions on how to set up your software or still need to download it, check out our downloads page! If you are still looking at whether or not to buy the best eye-tracking software for marketers from Gazepoint, check out our applications page to learn the many ways our eye trackers and software can be used!
1. Download and install Gazepoint software on your computer. (https://www.gazept.com/downloads/)
2. Unpack your Gazepoint GP3 device.
3. Attach tripod (or optional VESA or laptop mount) and cables to the GP3.
4. Position the GP3 to point at your eyes at an upwards angle. Ideally, the unit is 30 cm below eye level and 65 cm away.
5. Plug USB cables into your computer.
6. Start Gazepoint Control to calibrate your unit.
7. Start Gazepoint Analysis to begin capturing gaze data.
1. Rotate and position the arms based on the spacing of your display. Follow the text on the arms for instructions.
2. Screw arms into the bracket.
3. Screw bracket to the back of your display.
4. Remove thumbscrews at bottom of the bracket.
5. Fit mount into the hinge at bottom of the bracket and replace thumbscrews to secure it.
1. Prepare your text, image, and video file that will be used in your experiment.
A text file can be used to give instructions to your text subject at the start of your experiment. A text file is limited to 15 lines of display.
2. Start Gazepoint Control and calibrate your eye tracker.
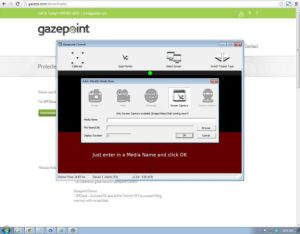
3. Start Gazepoint Analysis, begin a new project, and choose media type Text. Choose your .txt file and set the display duration.
4. In the Media List box on the left side, click the Add icon to add additional media items, which may be an image file. Choose your .jpg file and set your display duration. Repeat to add media item for the video file.
5. Minimize Control and Analysis windows or move them to your tester screen. We recommend a dual screen setup so that there is one for the test subject and one for the tester to start, stop, and monitor the testing.
6. Press CTRL + ALT + R or click Record to begin your experiment, and start recording. (Test subjects can use the spacebar to advance to the next media item.) Recording will stop after the last media item has been displayed.
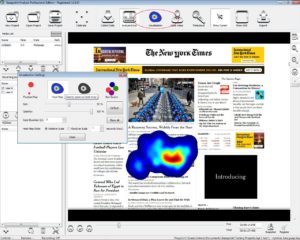
7. Click Analyze Data icon.
8. Click Fixationmap icon.
9. Click Play icon to review recording.
10. Click Export icon to export the data. Data is exported to the \result folder inside your project folder.
1. Start Gazepoint Control and calibrate your eye tracker.
2. Start Gazepoint Analysis, begin a new project, and choose media type Screen capture.
3. Minimize Control and Analysis windows.
4. Load your stimulus material, which can include an image, video, PDF, game, webpage, or other testing software.
5. Press CTRL + ALT + R to start recording, and begin your test.
6. Press CTRL + ALT + S to stop recording.
7. Click Analyze Data icon.
8. Click Visualization icon, and a settings window will provide different size and opacity choices.
9. Click Play icon to review recording
10. Click Export icon to export the data. Data is exported to the \result folder inside your project folder.
1. Start Gazepoint Control and calibrate your eye tracker.
2. Start Gazepoint Analysis, begin a new project, and choose media type Screen capture.
3. Minimize Control and Analysis windows.
4. Load your stimulus material, which can be an image, video, PDF, game, webpage, or other testing software.
5. Press CTRL + ALT + R to start recording, and begin your test
6. Press CTRL + ALT + S to stop recording.
7. Click the Analyze Data icon and click the Visualization icon to access the Visualization Settings. Choose a fixation map.
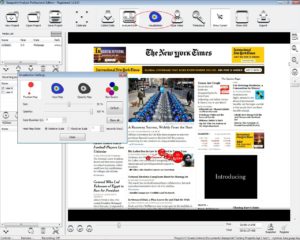
8. Click the Play icon to review recording.
9. Click the Export icon to export the data. Data is exported to the \result folder inside your project folder.
Data Files:
- 0001-user.csv – contains all captured data
- 0001-user-fix.csv – only the fixations are listed
- CurrentAOIStatisticsX.csv – lists the statistics for the AOIs (only created if AOIs are used)
- CurrentImageX.png – copy of image currently in the Analysis display window (can be paused at any point of recording)
CTRL+ALT+R = start data record
CTRL+ALT+S = stop data record
ALT+ left arrow = go to start of recording
ALT+ right arrow = go to end of recording
ALT+ z = toggle playback zoom
ALT+ p = play recording or pause recording
ALT+ up arrow = skip to previous recording
ALT+ down arrow = skip to next recording