
Information About Participants For Eye Trackers
A myriad assortment of informational resources and questions revolve around eye trackers. Much of these center on the studies and research they conduct in order to get data. At Gazepoint, we want to share with you more information about an important rung on the ladder in the world of eye trackers and eye tracking software: participants for your research!
Participants allow any research team to solidify presuppositions or discard any wrong information that might have been developing during the planning and research phase before the participants can be brought into the eye tracker’s study.
We will discuss this matter further and offer you some information about how to pick your participants, including myths that revolve around the eye trackers’ researches, and industry practices for sample sizes and methods. Let’s start!
Hire The Right Participants
We could be jumping to one of the most-asked questions which is: How many people do I need for my research? The problem with that question is that it does not matter the amount of budget that you are working with or the quantity of people you bring in to work with the eye tracker software, if the individuals you hire do not meet your needs for the study, many of the results from those participants can be unfit to satisfy your research criteria.

In order to recruit the right candidates that can satisfy all criteria and requirements, you need to be aware that some participants are simply not a good fit to be placed in a study to help the eye trackers yield useful information to be used later to determine patterns, problems, or whatever it may be that the research study is looking to prove or understand.
People with severe sight problems should not be considered for some research unless it’s being done under circumstances in which the participants need to fall under said category to provide the pertinent data.
In the case of glasses you can ask your applicants, if it’s imperative the use of visual aid, to wear contact lenses instead, as long as they are able to. Same goes for people with robust mounts or lens formulas that require a bigger frame; some of these factors can affect the eye tracker judgment on the results or the software to misread what’s being scanned.
Screening Process
In the screening process while looking for the right candidates, it is important to ask the right questions. If you believe that people who wear glasses are going to disturb your research and yield ambiguous results, it is wise to exclude people with glasses and be clear about this disqualifier in the questionnaire before going into the next rounds of recruitment.
Those who qualify after the screening process should be informed about the items they might need to bring to the study, or if they should or shouldn’t wear anything that can tamper with the final tracking results. Examples of this could be dark makeup or fake eyelashes as the dark color can be misread by the software as the pupil. Contact lenses can trap small air bubbles between the lens and the eye surface creating small, almost imperceptible air pockets that can distort the image with highlights and yield confusing or inaccurate readings to the eye tracker.
Recruiting More Than Needed
We have not talked about how many participants you would be needing for your studies, but it is important to know that recruiting more than your final number by a 5-10% is a good rule to follow. After all the screening processes, considering which would be the best candidates for your study, and all the time spent recruiting, it would be a shame to not finish the study because a small percentage of participants had a faulty performance or the eye tracker was unable to use their data. It’s better to have more data to work with at the end of your study than to have to go through the entire process again to hire a smaller number of participants in order to complete your studies.

Myth
Let’s talk about one myth in particular that found its roots in an eye tracking documentation* written by Kara Pernice and Jakob Nielsen. According to their work in this document, a sample of 30 participants can yield a “stable” result for heatmaps, and for them it might have worked, but in your case it could be that you are looking for other data.
This number could be useful for something as particular as what they were looking for at the moment of the study or for researchers that are looking for exactly the same data, but the truth is that there are many reasons why someone would need to perform extensive research and bring in participants to use the data in order to support their hypothesis or corroborate information.
All the previous information brings us to the apex of this post.
*You can find the document through this link: Click here!
How Many Participants Do You Need for Your Study?

When you are considering sample size for your eye-tracking research there are other aspects, besides the ones above, that can determine the number of participants you would be using for your studies. We can safely say that eye trackers and eye-tracking researchers are seldom the only people needing samples or participants to collect data. Many industries that use eye tracking software and hardware are also in constant need for user input and require data to move forward in their research. For this reason, there are other resources that dig deeper into this subject like the book from James R. Lewis and Jeff Sauro called “Quantifying the User Experience: Practical Statistics for User Research”. We will provide you some information about sample size and types of studies that can help you narrow down your final number.
First of all, you need to fully define what is the scope of your research and, at the bottom line, what is the question you need to answer and for what industry. If you are looking for data on heatmaps, you might be able to use the “rule of 30”, but don’t be so prematurely drawn to that conclusion.
You could be using a formative or a summative assessment for your research. Let’s dig a little more into those options.
Formative Studies
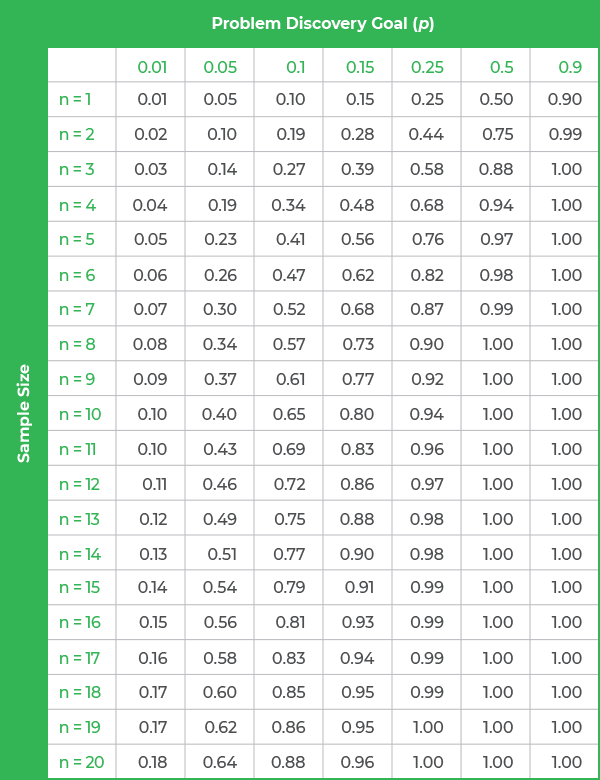
This type of study focuses on discovering shortcomings in a design. To determine your sample size using the formative methodology, you need to establish two numbers. The first number would be “Problem Discoverability” or (p), which is the average probability of detecting a problem. The second number is “Problem Discovery Goal” [P(x ≥ 1)] which is the desired probability of detecting the problem at least once during the study. Once these are defined, you can plug the numbers into the following formula: P(x ≥ 1) = 1 – (1 – p)ⁿ and solve for n. You can also check the table below as reference.
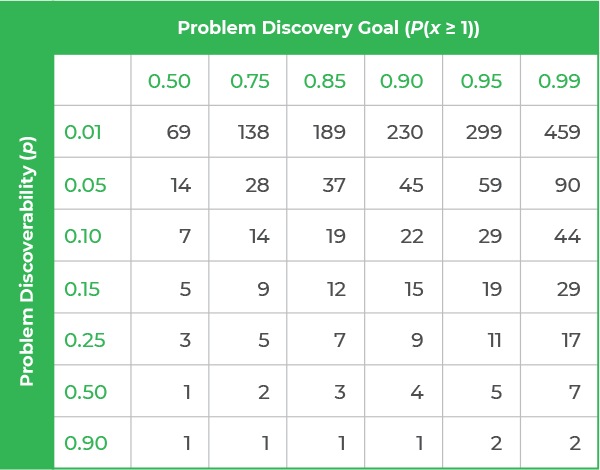
 The definition of p (problem discoverability) can be derived from previous or similar studies or it can be calculated from the results of the first few participants of the study, as long as you are comfortable with defining the final sample size mid-study.
The discovery goal directly affects the amount of participants you need to define the bottom line of the data you are collecting. The clearer you want your study to be, the more participants would need to be included in the study to reach a high percentage of discovery.
Summative Studies
Summative studies are used to measure the effectiveness of a design. The number of different types of measurements and different goals make it harder to determine your sample size. Determining the appropriate sample size for a summative study is more complicated than the formative method.
To choose the right method to calculate the sample size, you will have to consider many factors to ensure the results are reliable.
For summative studies, the formulas used to calculate sample size are the same formulas as those used for statistical tests performed on study results, although these formulas are transformed to solve for n. Choosing which formula to use depends on the same factors as selecting which statistical test to use.
The first factor will be defined by the reasoning behind taking the measurements and can be broken down into three different reasons:
- To estimate the value of a measurement
- To compare a measure to a criterion or established benchmark
- Or to compare measures to each other
Another factor in choosing a formula for sample size is considering whether the study is regarding continuous or binary measures. A continuous measure looks at the value of a certain metric. For example, the number of fixations or the time to first view an area of interest. A binary measure looks at the percentage of study participants who achieve a certain goal. For example, the percentage of participants who look at an area of interest.
There are lots of factors that need to be weighed to come to a conclusion on which sample size formula will be most useful. Once you have chosen the formula, you will need to feed some information through the formula before you can estimate the sample size required.
There are many examples of these types of studies out there for eye trackers to follow and use as instruction for their own benefit. In the book by James R. Lewis and Jeff Sauro called “Quantifying the User Experience: Practical Statistics for User Research” that we mentioned before, there’s more information about these processes.

Bottom Line
Defining a sample size, more often than not, will be based on the amount of available resources that stakeholders are able to put towards the study instead of calculations from formulas. One thing’s for sure: there is no one-number-fits-all solution for eye trackers when it comes to defining a sample size to start the hunt for the right data and it’s something that should always be considered.
Let’s Do a Quick Recap

Remember to include the pertinent questions about the conditions of the test in your screening to have a clean selection from the get go.
After defining sample size, don’t forget to add that extra 5 to 10% of the recruited pool into the study in case some of the candidates’ output results in unusable data.
You might get lucky with a random number that is said to be the end all be all sample size for eye trackers in their research, but the truth is that there’s not a one-size-fits-all number.
If you choose formative research, your sample size will be directly impacted by two numbers: average problem discoverability and the desired probability of detecting that problem at least once during the study.
If you choose summative research due to the need of measuring other type of data, then your sample size calculation will be defined by the following:
- Type of measurement
- Reason for said measurement
- Study design
- Critical difference
- Desired confidence level
- Desired power of the test
- Expected variance
At Gazepoint, we are proud to have provided a top-of-the-line technology to so many eye trackers and researchers pushing the boundaries of eye-tracking development while leading us to a more accurate future in the industry of eye tracking. You can check our Publications page and read the many citations we’ve received throughout the years in many research papers.
If you have any questions about our software or hardware or are interested in the product for your research studies, please contact us today! The team at Gazepoint will be happy to help you with anything related to our eye-tracking solutions!